Computing Simple Moving Average (SMA) with Python (Pandas & yfinance)

What is an SMA?
Simple Moving Average (SMA) is a technical indicator used in stock trading to analyze price action. More specifically, SMA is an arithmetic average calculation that sums the closing prices for the previous specified number of periods (or days), and divides that number by the number of periods.
Option Alpha gives the example, “A 50-period simple moving average finds the closing price of the last 50-periods, sums the 50 closing prices, and divides by 50 to calculate the average closing price of the previous 50 periods. New periods are then added to the calculation, while the oldest period is deleted from the calculation.”
Why use an SMA?
Simple moving averages are used to determine and predict price trends for an underlying security. SMAs can be used in a different number of ways to aid in your trading strategy. Traders typically read SMAs using one or more of the following ways:
- Determining if an asset is in an uptrend or downtrend
- If the stock price crosses from above the SMA to below the SMA, that is an indication to SELL the stock. If the stock price crosses from below the SMA to above the SMA, that is an indication to BUY the stock.
- A trader can plot two (2) different SMAs: a short-term and a long-term. A “golden cross” occurs when the short-term SMA crosses above the long-term SMA — indicating a bullish market is ahead and a potential opportunity to BUY. A “death cross” occurs when the short-term SMA crosses below the long-term SMA — indicating a bearish market is ahead and a potential signal to SELL.
Computing an SMA with Python
Now that you know what a simple moving average is, let’s calculate an SMA using Python, Pandas, and yfinance.
Installing the packages
We’ll be using yfinance to grab sample data to use for our SMA calculation. yfinance is an open-source tool that uses Yahoo’s publically available APIs to provide stock data for research purposes.
We’ll first need to install the necessary packages using pip .
pip install pandas
pip install yfinance
Grabbing data from yfinance
To grab data from the Yahoo APIs with yfinance, we can use the following code:
import yfinance as yf

stock = "AAPL"
start_date = "2020-01-01"
end_date = "2020-12-31"

stock_data = yf.download(stock, start=start_date, end=end_date)
The stock_data variable is a Pandas DataFrame that contains data about the Apple stock between the dates of 1/1/2020 and 12/31/2020. If we print the stock_data variable, we get the following output (not all data shown):
                  Open        High         Low       Close   Adj Close     Volume
Date
2020-01-02   74.059998   75.150002   73.797501   75.087502   73.152641  135480400
2020-01-03   74.287498   75.144997   74.125000   74.357498   72.441460  146322800
2020-01-06   73.447502   74.989998   73.187500   74.949997   73.018700  118387200
2020-01-07   74.959999   75.224998   74.370003   74.597504   72.675285  108872000
2020-01-08   74.290001   76.110001   74.290001   75.797501   73.844360  132079200
...                ...         ...         ...         ...         ...        ...
2020-12-23  132.160004  132.429993  130.779999  130.960007  128.687271   88223700
2020-12-24  131.320007  133.460007  131.100006  131.970001  129.679764   54930100
2020-12-28  133.990005  137.339996  133.509995  136.690002  134.317810  124486200
2020-12-29  138.050003  138.789993  134.339996  134.869995  132.529404  121047300
2020-12-30  135.580002  135.990005  133.399994  133.720001  131.399353   96452100

[252 rows x 6 columns]
The column we are interested in is the Close column. This shows us the closing price for the Apple stock for the corresponding date. This is important because we’ll be using the closing price in our SMA calculation.
Calculating the SMA
Now that we have our sample data, we can now calculate the simple moving average.
Side note: I like to grab a few days before our actual start date so that we can have an SMA calcuation from the first day onward. If we don’t do this — let’s say we used a 20-day period — our SMA calcuation for dates before the 20th day will return a null value.
Here is how we can compute the simple moving average with Python:
import yfinance as yf
import datetime as dt

def get_date_x_days_before(date_string, num_days_before):
    date_object = dt.datetime.strptime(date_string, "%Y-%m-%d")
    new_date = date_object - dt.timedelta(days=num_days_before)
    new_date_string = new_date.strftime("%Y-%m-%d")
    return new_date_string

stock       = "AAPL"
start_date  = "2020-01-01"
end_date    = "2020-12-31"
num_periods = 20

# Get a few days before the start date to accommodate the period size
start_date_x_days_before = get_date_x_days_before(start_date, num_periods*2)

# Grab the stock data
stock_data = yf.download(stock, start=start_date_x_days_before, end=end_date)

# Compute the simple moving average (SMA)
stock_data["SMA"] = stock_data["Close"].rolling(window=num_periods).mean()

# Now that we calculated the SMA, we can remove the dates before the actual
# start date that we want.
stock_data = stock_data[start_date:]
If we do a print(stock_data["SMA"]) call, we’ll get the following output:
Date
2020-01-02     69.797249
2020-01-03     70.243374
2020-01-06     70.671124
2020-01-07     71.017124
2020-01-08     71.470499
                 ...
2020-12-23    124.106000
2020-12-24    124.903000
2020-12-28    125.908001
2020-12-29    126.699000
2020-12-30    127.249000
Name: SMA, Length: 252, dtype: float64
We’ve successfully calculated the SMA for Apple over a 20-day period!
What does this look like?
If we graph the closing price and SMA together, it will look like this:
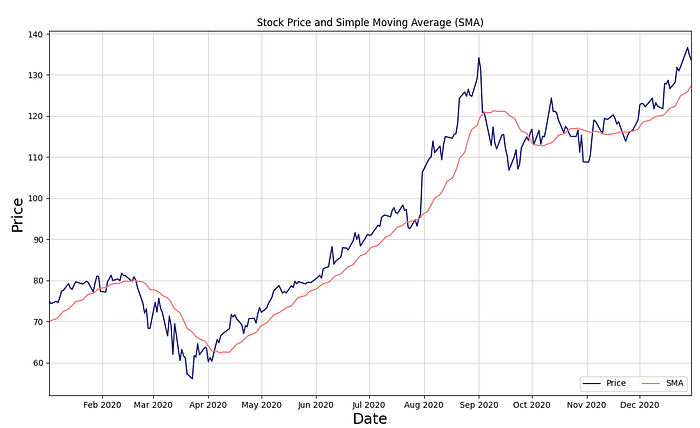
You can see how the SMA follows the closing price rather closely and could be used to predict trends in the stock.
We can tweak the number of periods to be greater than 20 and see how that changes the SMA. Let’s try a 50 day period:
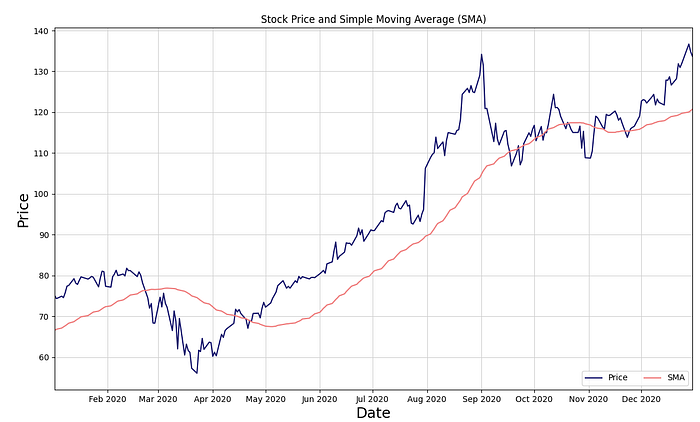
You can see how the 50 day period SMA is less responsive to the changing prices than the 20-day SMA. This can be a good or bad thing — depending on how you use it in your trading strategy. It’s up to you to determine the most optimal period size for your strategy.
Conclusion
There you have it! We were able to pull stock data with the yfinance library and compue a simple moving average using Pandas. Try it yourself and play with the period sizes to see how the numbers change.
Thanks for reading!